
Working with SQL Server Profiler Trace Files
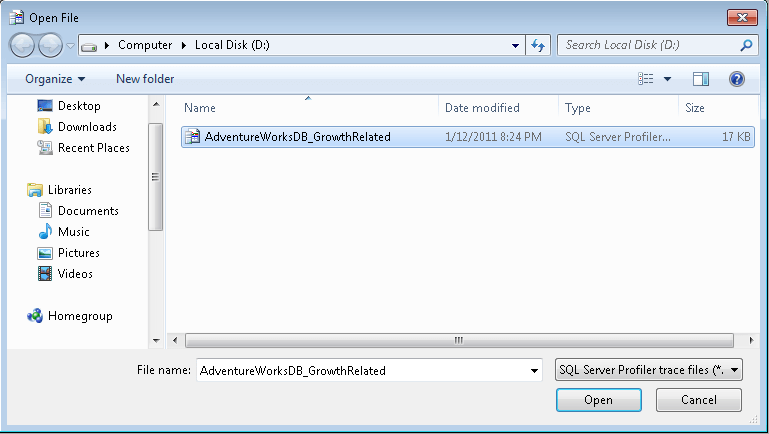
First we need to know the location of the old trace file. Once we are aware of this, we need to open the SQL Server Profiler. Upon opening Profiler, in the menu bar go to Open -> Trace File, as shown in the picture below.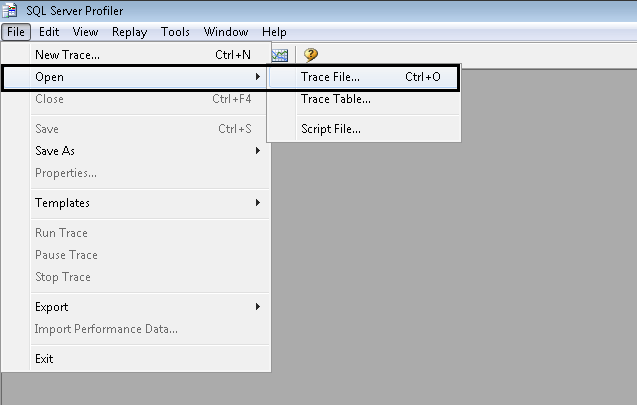
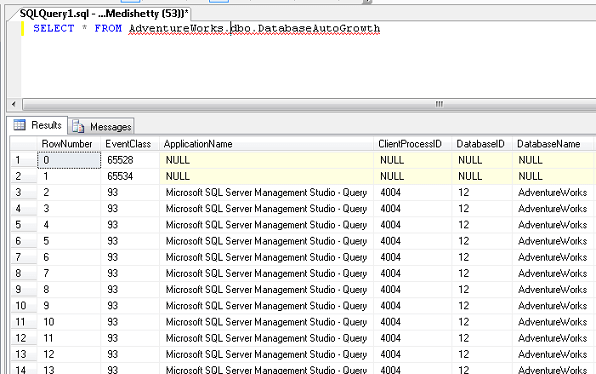
Saving a profiler trace inside a database table.
Why and how is this useful?
Saving a profiler trace in a database table has multiple benefits. One way is that you can query the table for more granular level details. By adding multiple WHERE clauses to your query you can find only those records you are interested in. One of my personal favorites is retrieving data for a certain time period. This way I can look at those details between 4:00 AM to 5:00 AM. Moreover I can add other conditions to dig deeper and weed out non-important data while trying to solve a particular issue.One other important benefit is we can delete data from the table that is not relevant making it easier while viewing the trace from Profiler.
Steps to do this.
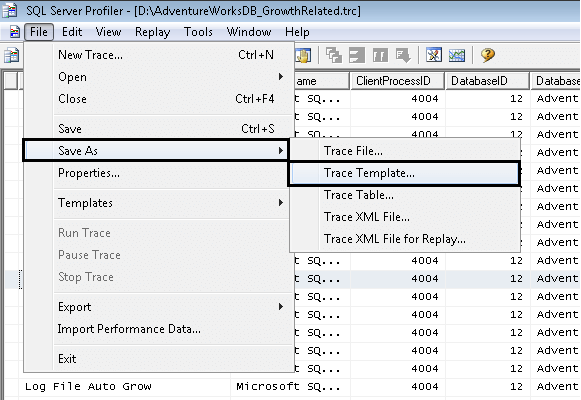
Open an existing trace file in SQL Server Profiler (described earlier in this tip). In the menu bar go to Save As -> Trace Table, as shown in the picture below.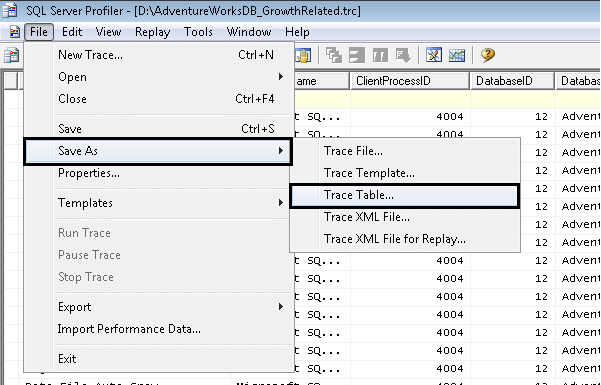
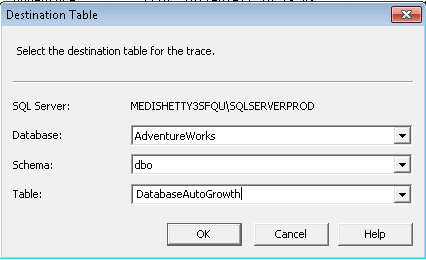
elow).
Ref:
https://www.mssqltips.com/sqlservertip/2232/working-with-sql-server-profiler-trace-files/
https://www.simple-talk.com/sql/performance/finding-the-causes-of-poor-performance-in-sql-server,-part-1/
Interpreting the Trace
The next step is to analyse the
trace file to determine which are the procedures and queries that are
placing the heaviest load on the server. I'm going to do that by loading
the trace file into a database on a dev server.
One option would be to load the
trace file into Profiler and then use Profiler's "save to database
table" option. However, I prefer to create a dedicated table, called TraceResults, and then use a built-in SQL function called fn_trace_gettable, to read the trace and import it into the table:
CREATE TABLE TraceResults (
TextData VARCHAR(4000),
Duration INT,
Reads INT,
Writes INT,
CPU INT,
StartTime DATETIME,
ProcedureName VARCHAR(100)
)
GO
INSERT INTO TraceResults
FROM fn_trace_gettable('F:\Traces\WebForums20090215193108.trc',1)
TextData VARCHAR(4000),
Duration INT,
Reads INT,
Writes INT,
CPU INT,
StartTime DATETIME,
ProcedureName VARCHAR(100)
)
GO
INSERT INTO TraceResults
(TextData, Duration, Reads, Writes, CPU, StartTime)
SELECT TextData, Duration/1000, Reads, Writes, CPU, StartTimeFROM fn_trace_gettable('F:\Traces\WebForums20090215193108.trc',1)
Notice that I'm dividing the
duration by 1000 because, in SQL 2005 and 2008, Profiler captures the
duration in microseconds, and I have no interest in durations with that
level of granularity.
The reason for using a script to
import the trace is twofold. Firstly it's easier and quicker to run a
single query than to start Profiler, load up the trace file and then
save it to a database table. Secondly, if the loading is done with a
script, then both the creation of the trace and the loading of it can be
automated using SQL Agent jobs. So, for example, you may have a job on
the main server to start the trace and then one on the dev server, which
starts an hour later, to copy the trace file over and import it.
Once I've got the trace file into a
table, I can query it. It's tempting to simply order by the duration,
reads or CPU and just focus on the top few records. However that is not
sufficient. Adopting this strategy here, I find that "most expensive"
query is a search query that has reads and duration far in excess of any
other query, as shown in Figure 3:

Figure 3: Finding the "most expensive" queries
However, further investigation shows that the search query only ran once in the entire sample period, as shown in Figure 4:

Figure 4: The query with the longest duration ran only once over the analysis period.
A query that runs only once a day
and minutes to run is less of an overall problem in general than one
that runs 10 times a second and takes a half second to run each time.
The queries that I need to optimise most urgently are the ones that
consume the highest cumulative amount of time, or CPU, or number of
reads, over the period monitored.
If ad-hoc SQL is involved,
calculating the cumulative time, reads or CPU can be extremely
non-trivial, as the slightly different query structures, and different
values that may be hard-coded within the query, can make it very
difficult to identify queries of the same pattern. Fortunately, this
application uses just stored procedures, and as such getting the
cumulative execution characteristics is relatively easy.
NOTE: Parsing and identifying
matching ad-hoc SQL Statements is extremely complex and there's no good
way to do it in T-SQL. For an app that uses a great deal of ad-hoc SQL,
I would recommend a tool like ReTrace to do the import and analysis, as it has the capability to parameterise queries that it reads from a trace file.
The following query will extract the name of the procedure from the text of the statement, using the EXEC
keyword to identify where the procedure name starts and a space to find
where it ends. This will not work perfectly in all cases, for example
when a procedure has a space in the name. As with ad-hoc SQL, there's no
easy method that will work in all cases to identify the procedure name,
but this does cover the majority of cases.
UPDATE TraceResults
SET ProcedureName =
LEFT(
RIGHT(TextData, LEN(TextData) - CHARINDEX(' ',TextData, CHARINDEX('Exec',TextData))),
CHARINDEX(' ', RIGHT(TextData, LEN(TextData) - CHARINDEX(' ',TextData, CHARINDEX('Exec',TextData))) + ' ')
)
SET ProcedureName =
LEFT(
RIGHT(TextData, LEN(TextData) - CHARINDEX(' ',TextData, CHARINDEX('Exec',TextData))),
CHARINDEX(' ', RIGHT(TextData, LEN(TextData) - CHARINDEX(' ',TextData, CHARINDEX('Exec',TextData))) + ' ')
)
where TextData like '%exec%'
Now that I have the procedure name
for each of the queries in my trace table, it's trivial to aggregate the
execution characteristics of these stored procedure over the sample
period, as shown in Figure 5:

Figure 5: Aggregating execution statistics by stored procedure
As you can see, the procedure that
had the both the highest total duration and the highest total IO is
"ViewThread", with a total duration summed over all executions of
1,815,846 milliseconds, a total number of IOs of 442,711,386 and an
execution count of 2377.
It's these procedures that I need
to tackle first, in my drive to improve the overall system performance.
I've often found, based on my experience performance tuning assorted
systems, that optimising the three most intensive procedures (by time,
CPU, reads or a combination) will result in dramatically improved
performance of the entire system. If overall performance does not
improve sufficiently, then I'll look at the next three procedures, and
so on.
I do not recommend ever trying to
optimise everything in one go. Firstly, trying to optimise all stored
procedures, in anything other than a tiny application, will take ages.
Secondly, changes made because of one procedure may completely change
the execution characteristics of a different procedure and invalidate
any work done on that.
No comments:
Post a Comment