
Finding User who ran DML(DROP/DELETE/UPDATE/INSERT) on SQL Server
Ref:
https://wikidba.wordpress.com/2013/12/30/finding-user-who-ran-dropdeleteupdateinsert-on-sql-server/
Ref:
https://wikidba.wordpress.com/2013/12/30/finding-user-who-ran-dropdeleteupdateinsert-on-sql-server/
Its commonly happened at all work place where a user trigger a DROP or DELETE command by mistake or intensely on a SQL Server and no one will be accepting who did this. Here, I would like to demonstrate a way using the transaction log to track down helpful information related to this incident.
As a standard, to find such users is with the help of the default trace, because the default trace
default trace :
http://sqltechi.blogspot.com/2012/12/default-trace-to-find-who-have-done.html
captures and tracks database activity performed on SQL Server instance, but if your system is very busy in that case the trace files may roll over far too fast and it may not be able to catch some of the changes in database. But these changes are also tracked in the transaction log file of the database and we will use this to find the users in questions.
To achieve this, we can use undocumented function fn_dblog
to find any unauthorized or unapproved deletes or table drops. The below tip will help to track or find any unethical or an unwanted user who has dropped a table or deleted data from a table. Its strongly suggested, Please don’t test this tips on production environment, test first it with test/Dev lab environment.
to find any unauthorized or unapproved deletes or table drops. The below tip will help to track or find any unethical or an unwanted user who has dropped a table or deleted data from a table. Its strongly suggested, Please don’t test this tips on production environment, test first it with test/Dev lab environment.
Here, I have created a Database Named ‘VIRENDRATEST’ and a create a Table Named ‘tblTest’ as
–Creating DB VirendraTest
USE [master]GO
CREATE DATABASE VirendraTest;GO
– Creating Table tblTest
USE VirendraTest;GO
CREATE TABLE tblTest ( ID INT IDENTITY, Ord_Date DATETIME DEFAULT GETDATE ())
– Inserting dummy test Data
INSERT INTO tblTest DEFAULT VALUESGO 100
Now, suppose, you have deleted record having ID=10 as
Delete tblTest where ID =10
Now here, find the user who deleted row/rows , steps are as below
- Find transaction ID from :SELECT [Transaction ID],Operation,Context,AllocUnitName FROM fn_dblog(NULL, NULL)WHERE Operation = ‘LOP_DELETE_ROWS’

- Now We have found the transaction ID from the above command which we will use in the below command to get the transaction SID of the user who has deleted the data from below command,SELECT Operation,[Transaction ID], [Begin Time], [Transaction Name], [Transaction SID]
FROM fn_dblog(NULL, NULL) WHERE [Transaction ID] = ‘0000:00000752′
AND [Operation] = ‘LOP_BEGIN_XACT’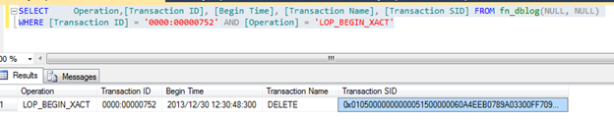
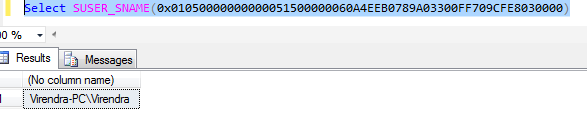
- Using Transaction ID , we can get exact user name asSelect SUSER_SNAME(0x01050000000000051500000060A4EEB0789A03300FF709CFE8030000)Above syntax will show exact user name.
 Below is the list from where we can find out operations timing with these types of details (It’s not a complete list, I just get it from self-practice and some Google)
| Sr. No. | OPERATION | DESCRIPTION |
| 1 | LOP_ABORT_XACT | Indicates that a transaction was aborted and rolled back. |
| 2 | LOP_BEGIN_CKPT | A checkpoint has begun. |
| 3 | LOP_BEGIN_XACT | Indicates the start of a transaction. |
| 4 | LOP_BUF_WRITE | Writing to Buffer. |
| 5 | LOP_COMMIT_XACT | Indicates that a transaction has committed. |
| 6 | LOP_COUNT_DELTA | |
| 7 | LOP_CREATE_ALLOCCHAIN | New Allocation chain |
| 8 | LOP_CREATE_INDEX | Creating an index. |
| 9 | LOP_DELETE_ROWS | Rows were deleted from a table. |
| 10 | LOP_DELETE_SPLIT | A page split has occurred. Rows have moved physically. |
| 11 | LOP_DELTA_SYSIND | SYSINDEXES table has been modified. |
| 12 | LOP_DROP_INDEX | Dropping an index. |
| 13 | LOP_END_CKPT | Checkpoint has finished. |
| 14 | LOP_EXPUNGE_ROWS | Row physically expunged from a page, now free for new rows. |
| 15 | LOP_FILE_HDR_MODIF | SQL Server has grown a database file. |
| 16 | LOP_FORGET_XACT | Shows that a 2-phase commit transaction was rolled back. |
| 17 | LOP_FORMAT_PAGE | Write a header of a newly allocated database page. |
| 18 | LOP_HOBT_DDL | |
| 19 | LOP_HOBT_DELTA | |
| 20 | LOP_IDENT_NEWVAL | Identity’s New reseed values |
| 21 | LOP_INSERT_ROWS | Insert a row into a user or system table. |
| 22 | LOP_LOCK_XACT | |
| 23 | LOP_MARK_DDL | Data Definition Language change – table schema was modified. |
| 24 | LOP_MARK_SAVEPOINT | Designate that an application has issued a ‘SAVE TRANSACTION’ command. |
| 25 | LOP_MIGRATE_LOCKS | |
| 26 | LOP_MODIFY_COLUMNS | Designates that a row was modified as the result of an Update command. |
| 27 | LOP_MODIFY_HEADER | A new data page created and has initialized the header of that page. |
| 28 | LOP_MODIFY_ROW | Row modification as a result of an Update command. |
| 29 | LOP_PREP_XACT | Transaction is in a 2-phase commit protocol. |
| 30 | LOP_SET_BITS | |
| 31 | LOP_SET_BITS | Designates that the DBMS modified space allocation bits as the result of allocating a new extent. |
| 32 | LOP_SET_FREE_SPACE | Designates that a previously allocated extent has been returned to the free pool. |
| 33 | LOP_SORT_BEGIN | A sort begins with index creation. – SORT_END end of the sorting while creating an index. |
| 34 | LOP_SORT_EXTENT | Sorting extents as part of building an index. |
| 35 | LOP_UNDO_DELETE_SPLIT | The page split process has been dumped. |
| 36 | LOP_XACT_CKPT | During the Checkpoint, open transactions were detected. |
Default trace
To Find out recent update/delete/loginchange/anyevent:
SELECT * FROM ::fn_trace_getinfo(default)
Note:
Run the 1 st query and paste the C:\programmefile\..trc and paste it to second query and run it.
mostly 5 log sizes are available so we have to replace and search it
SELECT top 15
loginname,
textdata,
RoleName,
TargetLoginName,
starttime,
e.name as EventName,
hostname,
applicationname,
servername,
databasename,
objectName,
e.category_id,
cat.name,
duration,
eventclass,
eventsubclass,
loginsid,
endtime,
spid
FROM ::fn_trace_gettable('C:\Program Files\Microsoft SQL Server\MSSQL.1\MSSQL\LOG\log_4192.trc',0)
INNER JOIN sys.trace_events e
ON eventclass = trace_event_id
INNER JOIN sys.trace_categories AS cat
ON e.category_id = cat.category_id
where e.name='Audit Add Login to Server Role Event'
order by starttime desc
select getdate() [currentdate and time]
We have all been subject to or know someone who has been in a situation where an object has been altered/created/deleted, without our knowledge, and the application comes to a screeching halt. After fixing the problem, your boss asks you some questions, like what happened, why did it happen, and who did it. SQL Server 2005 introduced a new type of trigger called a DDL trigger that can provide all the answers we need; however, you did not get a chance to implement this functionality. So... what do you do?
Some would tell their boss "I do not know, but I can find out" and then search franticly for 3rd party tools to read the transaction log, hoping for instantaneous salvation. What these few do not know is an answer is silently running in the background. SQL Server 2005 has built in functionality that gives administrators the answers to all these questions.
The answers lie in a new background trace called the default trace. The default trace is exactly what the name specifies, a trace. Default trace is always running in the background of your instance capturing events that administrators can use to troubleshoot problems. The default trace is enabled by default and does not burden the system because it is fairly lightweight. Chances are you had not even noticed this trace running on your instance. To those concerned about overhead, yes there is overhead, but in my mind the benefits far outweigh the minimal overhead. The default trace is not intended to replace DDL trigger functionality and should be used as a means to monitor an SQL Instance, or quickly obtain detailed information about problematic events.
The default trace does not capture all trace events, but captures enough information to become a powerful tool in your toolkit. The default trace captures key information including auditing events, database events, error events, full text events, object creation, object deletion and object alteration. From my experiences and observations on forums, I will be focusing on object level events. It seems that a greater number of people want the "who done it" answer for object DDL events.
The first piece of code is to check the default trace to see if it is enabled.
Note: the path is defaulted to the \MSSQL\LOG directory, but we can use the function below to get the path
** Make sure to use your trace file path below. Yours may be different than mine.

Now, we have seen what default trace is capable of. Let's create another object and repeat the query. This time around we are going to create a table called "MyTable". Use the following code to create the table.

Let's take the demo a step further by altering MyTable. Issue an alter table statement and add a new column to MyTable, as shown below.

Now lets drop MyTable and view the trace details. You must change the trace_event_id to 47 because event 47 represents the object:Deleted event, as shown below.

As you can see, default trace gives an administrator the ability to find the history of any DDL transaction. I want to point out that default trace is not limited to object DDL history. Among other things, default trace captures log growth events, which can be invaluable to troubleshooting disk capacity problems.
For example, say your log file spontaneous grows enormous. It is important to understand why the log grew spontaneously. No one would argue that one of the first place to look may be SQL Jobs. There are many commands within a job that can potentially cause the log to grow enormous, like reindexing, bulk inserts, bulk deletes etc. By using the trace data you can more easily identify the problem because you can pin-point the exact time the log file began to grow. This greatly reduces the number of possible suspects, which reduces the amount of time required to find the culprit.
The query below will pull all trace data using the log auto growth event. Note: You will not have any log growth for TraceDb because we have not done in large inserts to make the log grow. You should apply this query to another database where you want to monitor log growth.
The answers lie in a new background trace called the default trace. The default trace is exactly what the name specifies, a trace. Default trace is always running in the background of your instance capturing events that administrators can use to troubleshoot problems. The default trace is enabled by default and does not burden the system because it is fairly lightweight. Chances are you had not even noticed this trace running on your instance. To those concerned about overhead, yes there is overhead, but in my mind the benefits far outweigh the minimal overhead. The default trace is not intended to replace DDL trigger functionality and should be used as a means to monitor an SQL Instance, or quickly obtain detailed information about problematic events.
The default trace does not capture all trace events, but captures enough information to become a powerful tool in your toolkit. The default trace captures key information including auditing events, database events, error events, full text events, object creation, object deletion and object alteration. From my experiences and observations on forums, I will be focusing on object level events. It seems that a greater number of people want the "who done it" answer for object DDL events.
The first piece of code is to check the default trace to see if it is enabled.
SELECT * FROM sys.configurations WHERE configuration_id = 1568If this feature is not available, you will have to configure the advanced option "default trace enabled". Below is the code to enable the trace. Note: you will need the ALTER SETTNGS permission or be in the sysadmin or serveradmin fixed server role to reconfigure.
sp_configure 'show advanced options', 1;
GO
RECONFIGURE;
GO
sp_configure 'default trace enabled', 1;
GO
RECONFIGURE;
GO
The next piece of information we need is the default trace file path, and the function below will return the current trace file. You can grab the initial trace file (log.trc) and rollup every trace file into a single table, but there is a higher overhead associated to bringing more data in. You should use the trace file that best represents the information you are looking for.
Note: the path is defaulted to the \MSSQL\LOG directory, but we can use the function below to get the path
--get the current trace rollover file
SELECT * FROM ::fn_trace_getinfo(0)
Now that we have all the information we need we can get into the trace data. Let's start by creating a new database call TraceDB.
USE [master]
GO
CREATE DATABASE TraceDB
Now open the trace file, as shown below. As you can see, we were able to gather some pretty significant information about who created the database and when the database was created. I have used category id of 5 and a trace_event_id of 46 to filter the data correctly. Event ID 46 represents Object:Created and category 5 is objects. I will provide queries that list all events and categories at the end of this article.
** Make sure to use your trace file path below. Yours may be different than mine.
SELECT
     loginname,
     loginsid,
     spid,
     hostname,
     applicationname,
     servername,
     databasename,
     objectName,
     e.category_id,
     cat.name as [CategoryName],
     textdata,
     starttime,
     eventclass,
     eventsubclass,--0=begin,1=commit
     e.name as EventName
FROM ::fn_trace_gettable('C:\Program Files\Microsoft SQL Server\MSSQL.1\MSSQL\LOG\log.trc',0)
     INNER JOIN sys.trace_events e
          ON eventclass = trace_event_id
     INNER JOIN sys.trace_categories AS cat
          ON e.category_id = cat.category_id
WHERE databasename = 'TraceDB' AND
      objectname IS NULL AND --filter by objectname
      e.category_id = 5 AND --category 5 is objects
      e.trace_event_id = 46
      --trace_event_id: 46=Create Obj,47=Drop Obj,164=Alter Obj
- You will see more than one entry per object create because these objects have two event sub classes -begin and commit. Each subclass will have an entry.
- You can remove the databasename filter to get object creation events for all databases.
Now, we have seen what default trace is capable of. Let's create another object and repeat the query. This time around we are going to create a table called "MyTable". Use the following code to create the table.
USE [TraceDB]
GO
CREATE TABLE [dbo].[MyTable](
 [id] [int] IDENTITY(1,1) NOT NULL,
 [sometext] [char](3) NULL
) ON [PRIMARY]
Now query the default trace using the same query as above. Note you can use the ObjectName column to filter for the specific object you are looking for; otherwise all created database objects are returned.
WHERE databasename = 'TraceDB' AND
      objectname = 'MyTable' AND --filter by objectname
      e.category_id = 5 AND --category 5 is objects
      e.trace_event_id = 46
      --trace_event_id: 46=Create Obj,47=Drop Obj,164=Alter Obj
Results (Trimmed for Simplicity):Let's take the demo a step further by altering MyTable. Issue an alter table statement and add a new column to MyTable, as shown below.
USE [TraceDB]
GO
ALTER TABLE MyTable
ADD col INT
We can now search trace information on the alter event for MyTable. We can use the same query as before but need to make a small modification. You must change the trace_event_id to 164 because event 164 represents the object:Altered event.
WHERE databasename = 'TraceDB' AND
      objectname = 'MyTable' AND --filter by objectname
      e.category_id = 5 AND --category 5 is objects
      e.trace_event_id = 164
      --trace_event_id: 46=Create Obj,47=Drop Obj,164=Alter Obj
Results (Trimmed for Simplicity):Now lets drop MyTable and view the trace details. You must change the trace_event_id to 47 because event 47 represents the object:Deleted event, as shown below.
USE [TraceDB]
GO

DROP TABLE MyTable
We can view trace data by changing the trace_event_id to 47.
WHERE databasename = 'TraceDB' AND
      objectname = 'MyTable' AND --filter by objectname
      e.category_id = 5 AND --category 5 is objects
      e.trace_event_id = 47
      --trace_event_id: 46=Create Obj,47=Drop Obj,164=Alter Obj
Results (Trimmed for Simplicity):As you can see, default trace gives an administrator the ability to find the history of any DDL transaction. I want to point out that default trace is not limited to object DDL history. Among other things, default trace captures log growth events, which can be invaluable to troubleshooting disk capacity problems.
For example, say your log file spontaneous grows enormous. It is important to understand why the log grew spontaneously. No one would argue that one of the first place to look may be SQL Jobs. There are many commands within a job that can potentially cause the log to grow enormous, like reindexing, bulk inserts, bulk deletes etc. By using the trace data you can more easily identify the problem because you can pin-point the exact time the log file began to grow. This greatly reduces the number of possible suspects, which reduces the amount of time required to find the culprit.
The query below will pull all trace data using the log auto growth event. Note: You will not have any log growth for TraceDb because we have not done in large inserts to make the log grow. You should apply this query to another database where you want to monitor log growth.
SELECT
     loginname,
     loginsid,
     spid,
     hostname,
     applicationname,
     servername,
     databasename,
     objectName,
     e.category_id,
     cat.name,
     textdata,
     starttime,
     endtime,
     duration,
     eventclass,
     eventsubclass,
     e.name as EventName
FROM ::fn_trace_gettable('C:\Program Files\Microsoft SQL Server\MSSQL.1\MSSQL\LOG\log.trc',0)
     INNER JOIN sys.trace_events e
          ON eventclass = trace_event_id
     INNER JOIN sys.trace_categories AS cat
          ON e.category_id = cat.category_id
WHERE databasename = 'TraceDB' AND
      e.category_id = 2 AND --category 2 is database
      e.trace_event_id = 93 --93=Log File Auto Grow
Summary:
The default trace is a valuable tool for the modern DBA's tool belt. It offers a wealth of information, while minimally impacting the system. The default trace is not a widely publicized feature of SQL Server 2005, but is slowly gaining fame. The default trace gives administrators the ability to get detailed information about auditing events, database events, error events, full text events, object creation, object deletion and object alteration events. With this much information at their fingertips, administrators are more productive and can more easily identify problems in a production environment. My recommendations are to look through the events and see what information already exists for your instances. Default trace should not only be used reactively but proactively. A proactive mentality will reveal small problems before they escalate to bigger problems.Event and Category Queries
--list of events
SELECT *
FROM sys.trace_events
--list of categories
SELECT *
FROM sys.trace_categories
--list of subclass values
SELECT *
FROM sys.trace_subclass_values
--Get trace Event Columns
SELECT
     t.EventID,
     t.ColumnID,
     e.name AS Event_Descr,
     c.name AS Column_Descr
FROM ::fn_trace_geteventinfo(1) t
     INNER JOIN sys.trace_events e
          ON t.eventID = e.trace_event_id
     INNER JOIN sys.trace_columns c
          ON t.columnid = c.trace_column_id
No comments:
Post a Comment