Data viewers are a very important feature in SSIS for debugging your data pump pipeline. They allow you to view data at points in time at runtime. If you place a data viewer before and after the Aggregate Transform, you can see the data flowing into the transform at runtime and what it looks like after the transform happens. There is one fantastic feature in this Data Viewers i.e Once you deploy your package and run it on the server as a job or with the service, the data viewers do not show because they are only a debug feature. Anytime the package is executed outside the designer, the data viewers won’t show.
There are four types of data viewers:
- Grid
- Histogram
- Scatter Plot
- Column Chart
1. Grid:
- GRID Type Will displays the columns in the Grid Format.
2. Histogram:
- Select Histogram when columns wants display in histogram model
- Histogram graph works only with 1 column at a time.
- Histogram graph works only with numeric data
3. Scatter Plot:
- Scatter Plot (x.y) works only with numeric data.
4. Column Chart:
- Select Column Chart when columns want to display in the column chart.
- This graph only works with 1 column at a time.
In this post, let us see a simple example to configure GRID Data Viewers in a Data Flow task.
- Open a new project and drag a Data Flow task from toolbox in Control Flow.
- Edit the Data Flow task by double clicking the object or by selecting EDIT button on Right click on the object. Make sure the Data Flow Page is opened as shown below.
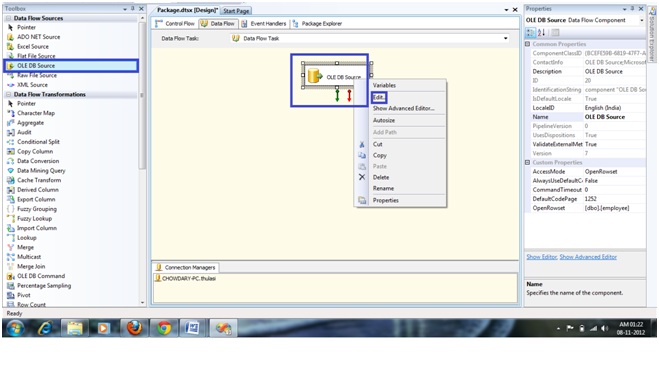
- Select an OLE DB data sources from data flow sources and drag and drop it in the data flow.
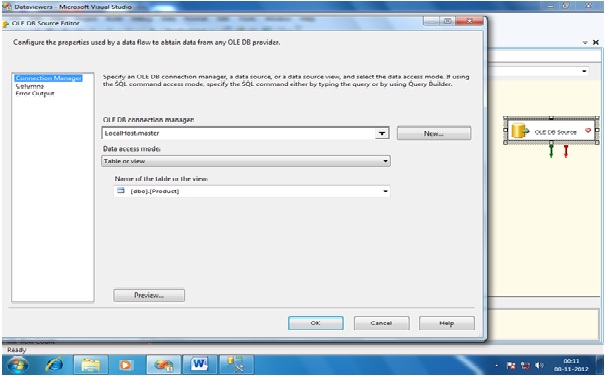
- Double click on the OLE DB data source to open a new window where we can set the properties of the connection.
- Select the connection manager and click on new button to set the connection string to the table of your wish as shown below.
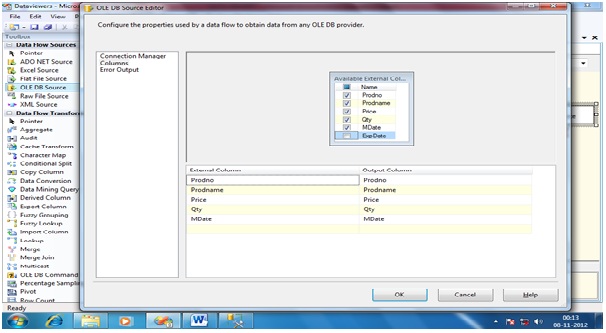
- Select the required columns from the COLUMNS TAB(Page) as shown below.
- Drag and Drop the Flat File Destination, make a connection between the OLE DB Source and Flat File Destination and configure it.
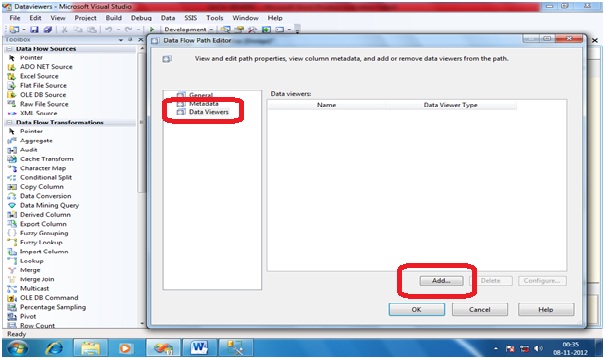
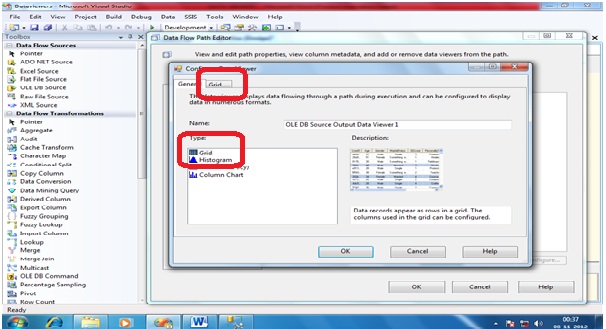
- Double click on the pipeline connecting OLE DB Source and Flat File destination to configure Data Viewers properties and click on ADD to add a new Data Viewer as shown below.
- You can find all the FOUR different types of Data Viewers you can set and select GRID as we are covering about only GRID in this post.
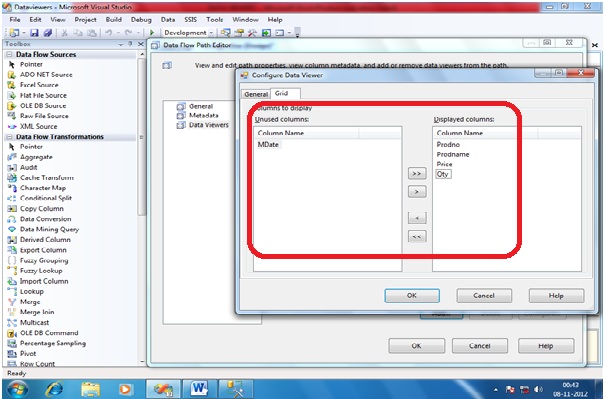
- Select the GRID tab and select the columns for which we wish to see the data in Data Viewers. By default all the columns will be selected and we can deselect any column which we don’t want to be part of Data Viewer and then click OK as shown below.
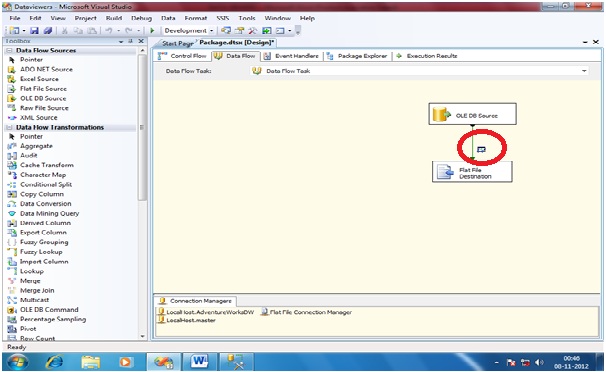
- Now you can see an ICON showing the Data Viewer is created for a path as shown below.
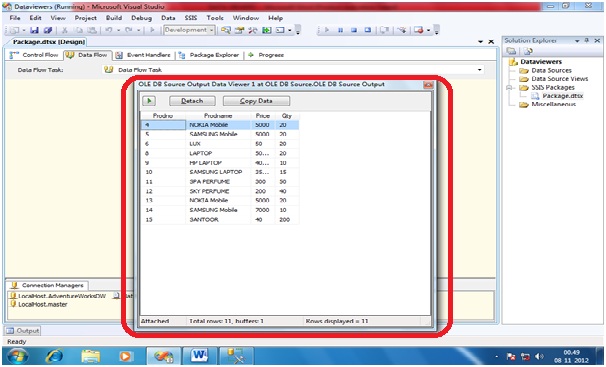
- Now the package is all set to test Data Viewers functionality and hence trigger the package. Once the execution reaches to the point of Data Viewer, the GRID will be opened and shown as below.
In the above picture, the highlighted part is the Data Viewer where you can see the columns configured as part of GRID Data Viewer configuration.
That is it .. In next post we will see about the remaining types of Data Viewers like Histogram,Scatter Plot and Column Chart. Till then enjoy Coding !!


No comments:
Post a Comment