
Different techniques to identify blocking in SQL Server
Problem
SQL Server is able to service requests from a large number of concurrent users. When SQL Server is servicing requests from many clients, there is a strong possibility that conflicts will occur because different processes request access to the same resources at the same time. A conflict in which one process is waiting for another to release a resource is called a block. Although in SQL Server a blocked process usually resolves itself when the first process releases the resource but there are times when a process holds a transaction lock and doesn’t release it. In this tip, we will learn different techniques to troubleshoot and resolve blocks in SQL Server.Solution
In order to resolve a blocked process, we first need to determine which process is the blocking process and then if possible kill the blocking process. There are many different ways in SQL Server to identify a blocks and blocking process that are listed as follow:- Activity Monitor
- SQLServer:Locks Performance Object
- DMVs
- sys.dm_exec_requests
- sys.dm_tran_locks
- sys.dm_os_waiting_tasks
- SQL Server Profiler Locks Event Category
1) Activity Monitor
Activity Monitor is a tool in SQL Server Management Studio that gives you a view of current connections on SQL Server. You can use Activity Monitor to view information about the current processes and locks held on SQL Server resources. To open Activity Monitor in SQL Server Management Studio, right-click the SQL Server instance name in Object Explorer and then select Activity Monitor: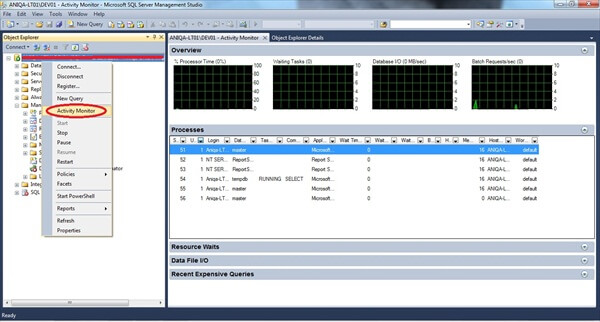
Launch Activity Monitor
To find blocked process with Activity Monitor, first click on Processes in Activity Monitor to open the Process Info page: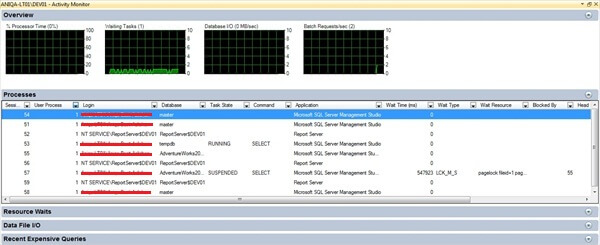
Process Info Page and Locating Blocking Process
Then locate the process that is waiting, and then scroll over to the Blocked By column and note the Process ID in that column. Find that Process ID in Process Info page. and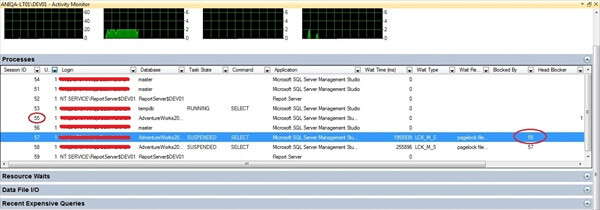
2) The SQLServer:Locks performance object
You use SQLServer:Locks object counter in Performance Monitor to view current statistics or create a log or alert to monitor locks. For example, you can monitor Average Wait Time, Number of deadlocks/sec and Lock Timeouts/sec statistics to determine whether there is a problem with resource contention on SQL Server. However, you will need additional information to determine the exact cause of the problem. Follow the steps below to monitor the SQLServer: Locks performance counter:On the Start menu, point to Run, type perfmon in the Run dialog box, and then click OK to launch Performance Monitor.
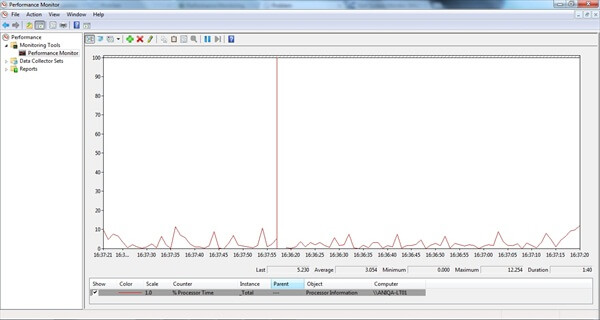
Launching Performance Monitor
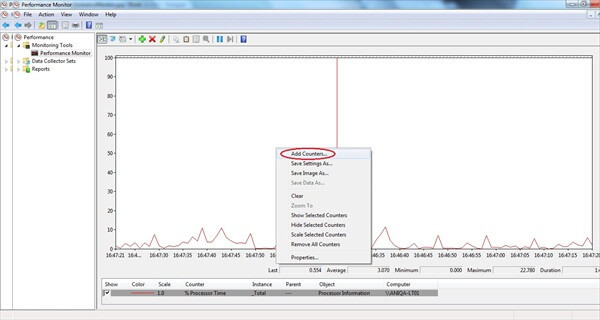
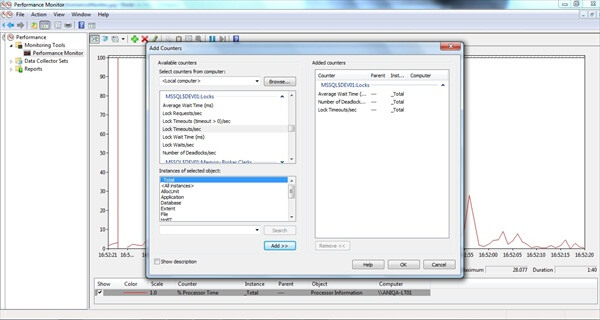
Add counters
- Average Wait Time
- Number of deadlocks/sec
- Lock Timeouts/sec
3) DMVs (Dynamic Management Views)
sys.dm_exec_requests
You can use the sys.dm_exec_requests dynamic management view to obtain detailed information about the requests currently executing on SQL Server. The dynamic management view includes detailed information about the query and query plan, status of request and information about the amount of time it has been executing. The columns you are most likely to use when troubleshooting a block or deadlock are as follow:- blocking_session_id - The SPID of the blocking session.
- wait_type - Type of wait.
- wait_time - Length of time request has been waiting (in milliseconds).
- last_wait_type - If a wait has ended, its type is listed here.
- wait_resource - Name of resource the request is waiting for.
- transaction_isolation_level - Isolation level for the transaction.
- lock_timeout - Length of time a lock can exist before timing out
USE [master]
GO
SELECT  session_id
 ,blocking_session_id
 ,wait_time
 ,wait_type
 ,last_wait_type
 ,wait_resource
 ,transaction_isolation_level
 ,lock_timeout
FROM sys.dm_exec_requests
WHERE blocking_session_id <> 0
GO
sys.dm_tran_locks
You can view information about current locks and the processes blocking them using the sys.dm_tran_locks dynamic management view. This column has one of three values: GRANT, WAIT or CONVERT. The value of CONVERT means that the requestor has been granted a request but is waiting to upgrade to the initial request to be granted. To locate information about all locks with a request status of CONVERT, you execute the following:USE [master] GO SELECT * from sys.dm_tran_locks WHERE request_status = 'CONVERT' GO
USE [master]
GO
SELECT   tl.resource_type
 ,tl.resource_associated_entity_id
 ,OBJECT_NAME(p.object_id) AS object_name
 ,tl.request_status
 ,tl.request_mode
 ,tl.request_session_id
 ,tl.resource_description
FROM sys.dm_tran_locks tl
LEFT JOIN sys.partitions p
ON p.hobt_id = tl.resource_associated_entity_id
WHERE tl.resource_database_id = DB_ID()
GO
sys.dm_os_waiting_tasks
The sys.dm_os_waiting_tasks dynamic management view reports information about the blocked and blocking processes. The blocked process is listed in the session_id column. The blocking is listed in the blocking_session_id column.Execute the following to view wait stats for all block processes on SQL Server:
USE [master]
GO
SELECT   w.session_id
 ,w.wait_duration_ms
 ,w.wait_type
 ,w.blocking_session_id
 ,w.resource_description
 ,s.program_name
 ,t.text
 ,t.dbid
 ,s.cpu_time
 ,s.memory_usage
FROM sys.dm_os_waiting_tasks w
INNER JOIN sys.dm_exec_sessions s
ON w.session_id = s.session_id
INNER JOIN sys.dm_exec_requests r
ON s.session_id = r.session_id
OUTER APPLY sys.dm_exec_sql_text (r.sql_handle) t
WHERE s.is_user_process = 1
GO
4) SQL Server Profiler
You use the SQL Server Profiler Locks event category to create a trace of events related to locks and deadlocks. You can choose one or more of these event classes:- Deadlock_Graph_Event_Class — Creates an XML description of deadlocks.
- Lock:Acquired — Use in conjunction with Lock:Released to determine the types of locks being requested and the length of time they are retained.
- Lock:Cancel — Use to determine which locks are cancelled.
- Lock:Deadlock Chain — Use to determine the objects involved in a deadlock.
- Lock:Deadlock — Use to determine the objects and applications involved in a deadlock.
- Lock:Escalation — Reports information about locks that have been escalated to cover a larger resource. For example, when a row lock becomes a table lock.
- Lock:Released — Use in conjunction with Lock:Acquired.
- Lock:Timeout(timeout>0) — Provides information about locks that have timed out due to blocking issues.
- Lock:Timeout — Provides the same information as Lock:Timeout (timeout>0), but includes timeouts where the duration was 0.
5) sp_who/sp_who2
Both sp_who/sp_who2 return information about all the sessions that are currently established in the database and these are denoted as spid's. Both these store procedures accepts parameters. The blk column of sp_who and blkby column of sp_who2 contains the spid for blocking process. Running sp_who and sp_who2 is easy, for example following call of these procedures returns all process that are currently active on SQL Server:USE master; GO EXEC sp_who 'active'; GO EXEC sp_who2 'active'; GO
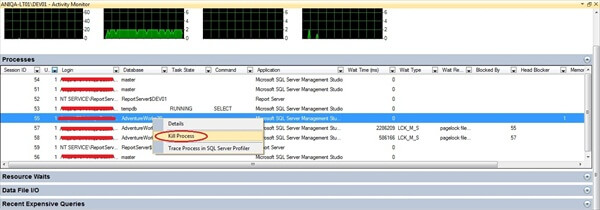
6) Use KILL statement to terminate blocked process
You use the KILL statement to view the status of a process or kill the process. The KILL statement has the syntax: KILL spid | UOW [WITH STATUSONLY]USE master; GO KILL spid | UOW [WITH STATUSONLY] GO
Another approach is to put the database into single user mode closing all open connections, i.e...
USE master;
GO

-- Put database into single user mode closing open connections
ALTER DATABASE <databasename>
SET SINGLE_USER
WITH ROLLBACK IMMEDIATE;

-- Put it back into multi user mode
ALTER DATABASE AdventureWorks
SET MULTI_USER;
No comments:
Post a Comment